![]()
Business Scorecard
As we all know, you cannot effectively manage something unless you can measure it. You cannot increase the probability of reaching your desired goal or outcome unless you monitor the key activities that produce that outcome. To really understand how well your business system is functioning and better control the destination or outcome, Proxcent can help you develop the instrumentation and reporting needed to make the right business decisions in real-time. The Business Scorecard service will provide you with real-time data for taking control of your business whether it be a specific project, program, strategy, business unit or in managing the entire business to reach your corporate vision.
Purpose & Goals
The primary purpose of this services is to provide your key decision makers with real-time data on the critical success factors that drive a particular initiative to reach the specific goals for that initiative. By monitoring and understanding how the leading indicators correlates and drives the end results your team can make the decisions needed to adjust resources, training, processes, etc., before they can negatively impact the initiative. This will result in...
- Increasing the probability of success for mission critical initiatives by enabling key decision makers to effectively manage those initiatives.
- Ensure all teams are being held accountable for results and provide guidance and support if they are struggling to meet objectives.
- Provide executives and managers with best practices knowledge and tools to be better business leaders and increase their probability of success and value to your company.
Approach
By working directly with business leaders and execution teams, Proxcent will help you identify and better understand what needs to be monitored and managed to help your teams be successful. As always, a team approach is required so that goals, metrics and critical processes are well understood and agreed to by all stakeholders. In fact, the working sessions themselves will provide significant value to your teams in helping them plan the execution of key initiatives. Moreover, because the team developed and agreed upon the most critical success factors, they will be highly motivated to achieve the targets for each of the established performance metrics.
The development of the Business Scorecard tool and associated reporting processes will follow a logical format where we begin with the end in mind to fully understand the final measure of success. We will then work backwards in time to derive the most important properties and metrics that will influence the final outcome and well as help plan the execution. The final reporting tools and processes with then drive decision making as you adaptively execution the plan to reach the specified outcome. This will be accomplished as follows:
Observable Properties:
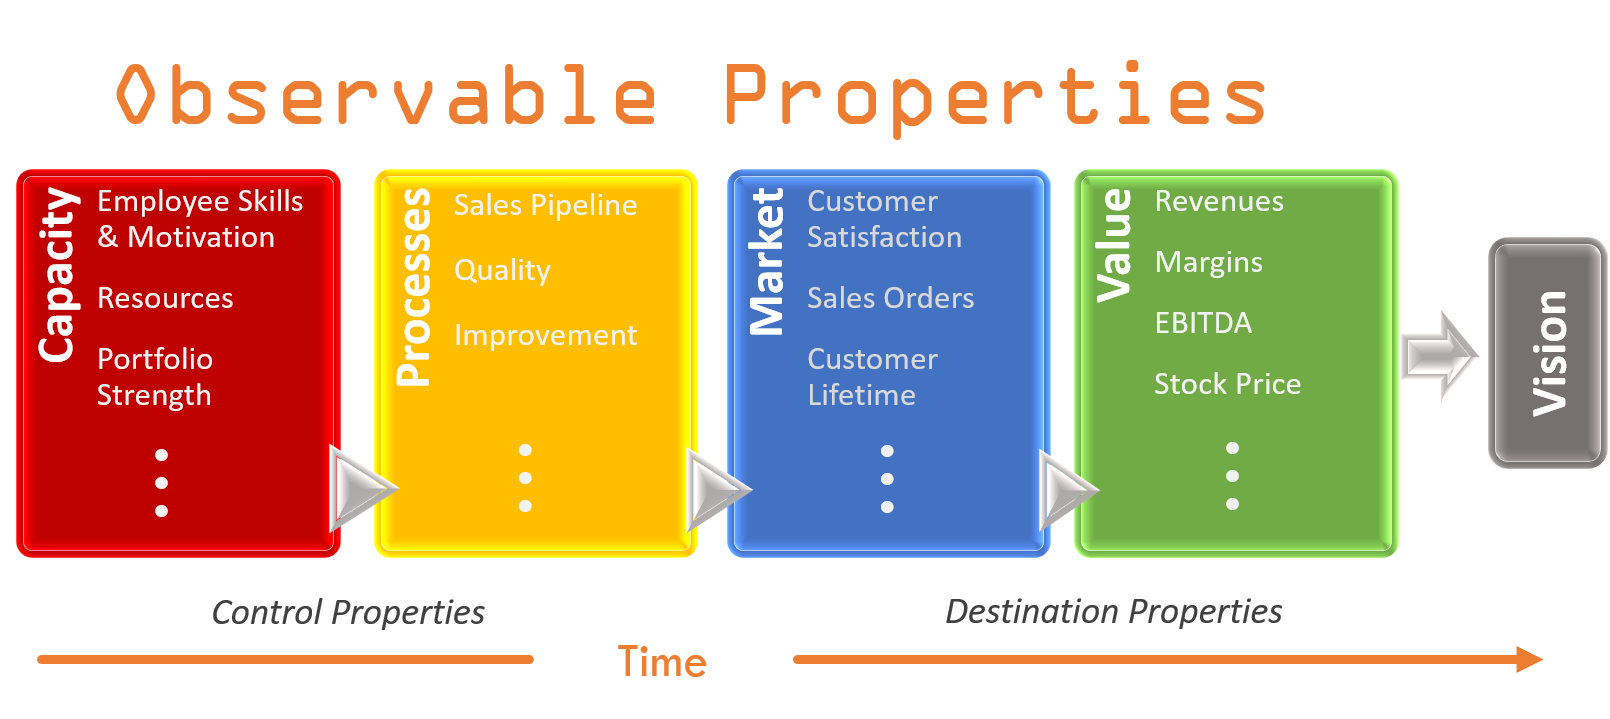
The first step is to determine what primary observable properties we should monitor in each of the fundamental elements of Capacity, Processes, Market and Value to reach your corporate Vision. For planning purposes, we always need to begin with the end in mind. Therefore, for a specific project, program or business unit we would need to first identify the specific target goals that you feel would be the measure of success for that particular item.
For example, let’s say you want to increase quarterly revenue for a particular product line by 25% in 12 months. Given that, we would start with the Revenue property in the Value element. Next we would determine what properties in the Market element would influence revenue for that product line. Customer Satisfaction and Sales Orders would be drivers of revenue so they would be monitored. The next element to look at would be Processes. What properties in that element would influence customer satisfaction and sales? Properties like Quality and Sales Pipeline would be good areas to monitor closely. Finally, we would determine the properties in Capacity that would influence quality and the sales pipeline. Obviously, the QA and Sales Resources would be important, but also their skill level and productivity would be a factor.
When we start execution, this becomes a time progression where the properties for Capacity and Processes can be considered our “Control Properties” as they are the ones we have the most control over and will help us better control our business. Properties for Market and Value can be considered as our “Destination Properties” as they determine if we are approaching the destination goal we established in the beginning.
Empirical Measurements:
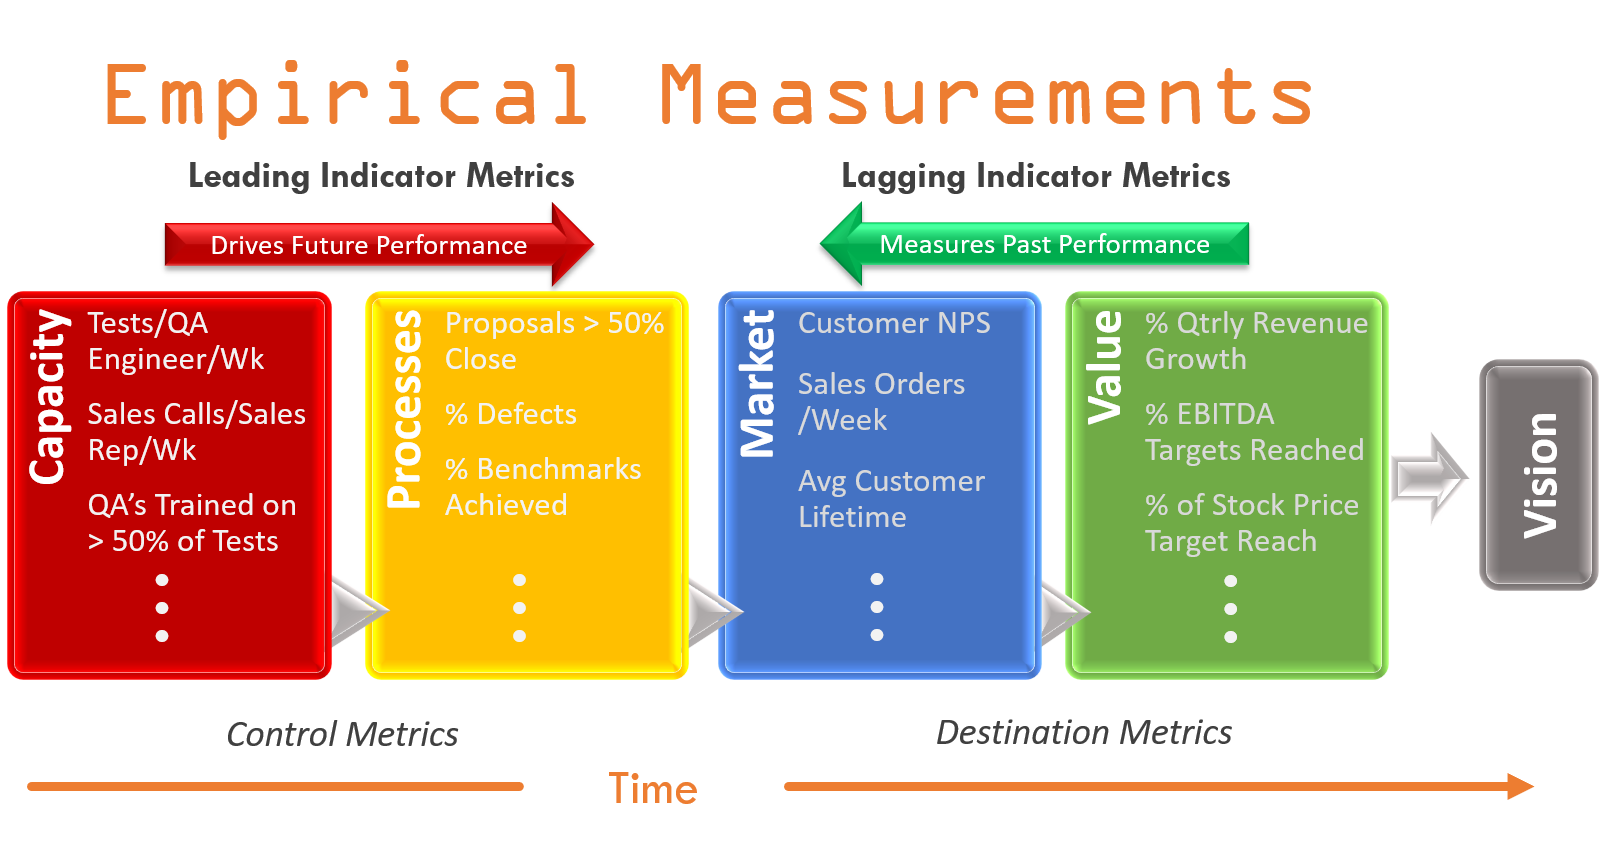
Now we need to determine what we need to measure for each observable property we decided to monitor. If performance metrics are already being tracked that correspond to a property we want to monitor, then we should include those. Those not yet being tracked would need to defined and measurement processes put in place.
For our example, the Revenue metric would be something like % Quarterly Revenue Growth. For Customer Satisfaction it could be an NPS score that is measured each quarter, seeing as that is probably as frequent in which NPS could be tracked. Since possible, we would want to track Sales Orders weekly. For Quality and Sales Pipeline we could track % Defects and number of Proposals with > 50% Close probability respectively. Finally, for Resources it would not only be the current count, but also things like Tests/QA Engineer/Week or Sales Calls/Rep/Week to measure productivity. Their skill could be tracked with metrics like QA’s Trained on > 50% of Test.
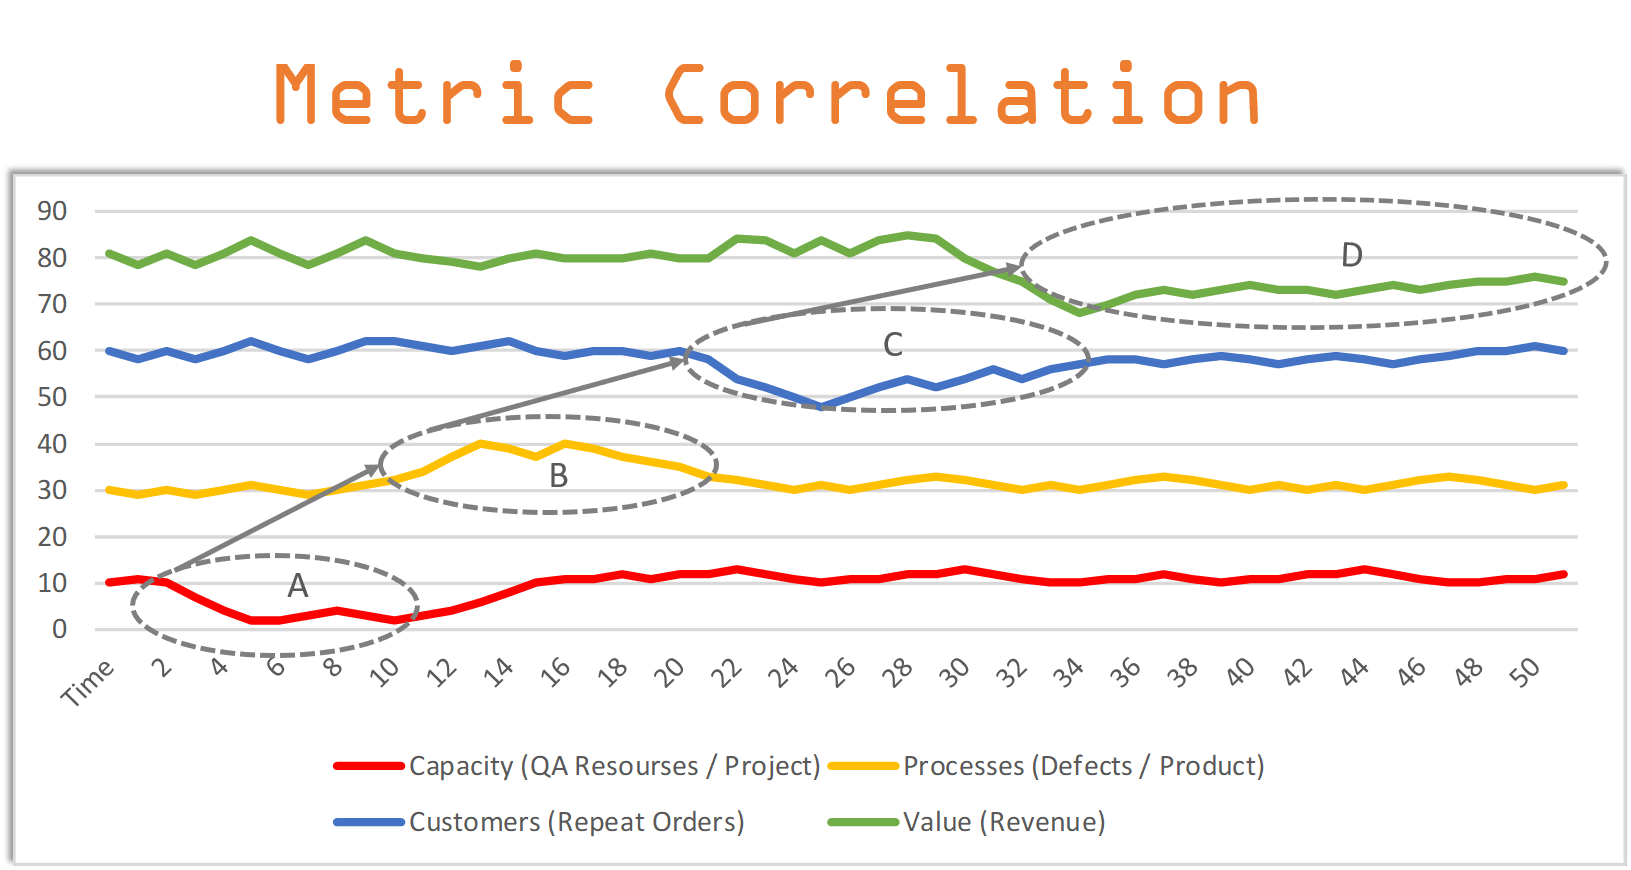
All of these properties and metrics will depend on the final goal and measure of success, but can be derived in a very logical fashion. Specifically, we must chose the right performance metrics in each element, but is best if they can be expressed as a function of time, resource or physical item to measure efficiency. We must also benchmark each metric to determine current performance use that to set realistic targets needed to reach the end result. Finally, we will measure these metrics weekly, if possible, and report on how they compare to target performance metrics. This model progressively aligns the key elements and their associated metrics. It provides a time perspective of the metrics and makes it clear the Leading Indicators that you need to monitor the closest are the Control Metrics associated with Capacity and Processes. This drives future performance. The values you measure for Destination Metrics today depends on the values that were measured for Capacity and Processes at some time in the past. Given that, then Destination Metrics are your Lagging Indicators and only Measures Past Performance. Once you know these values its too late to change the outcome. As execution continues it will be obvious as to how these metrics correlate over time.
Deliverables
- Working sessions with leadership team to determine vision or primary goals for project, program or business unit that will be the measure of success
- Working sessions with appropriate teams to determine observable properties and performance metrics for each fundamental element that will progressively influence the measure of success.
- Working sessions with appropriate teams to establish the measurement processes for tracking performance metrics and establishing initial benchmarks and targets for each performance metric
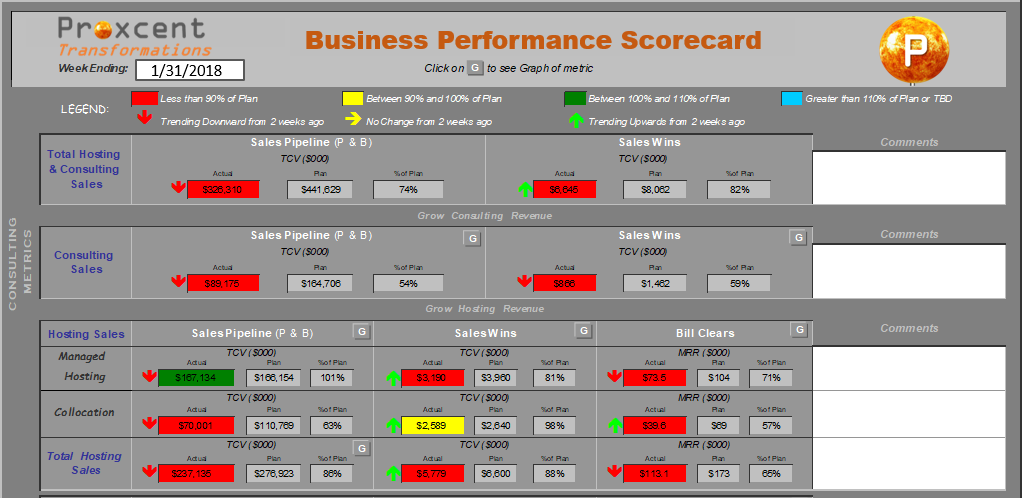
- Excel based Business Scorecard that…
- Tracks leading performance metrics and shows how they are progressively aligned with lagging metrics
- Shows actual results and compare them to the desired result in an easy to understand format
- Shows trends and indicates the status of both results and trends to allow decision makers to focus in on problem areas quickly
- Shows trending graphs that tracks metrics over time and indicated how metrics correlate as function of time.
- Working with reporting team to integrate Business Scorecard into existing reporting or BI system to a level that can be achieved